Admin Console
Inspect, correct, and operate MemexAI memory files, revisions, access logs, observability, tools, and dreaming.
The MemexAI service includes an admin console at /admin. Use it to make agent memory visible: open the durable memory files, inspect revision history, review access logs, test memory tools, and monitor memory health.
Access
In the Docker service, open:
http://localhost:8080/adminThe admin console uses:
MEMEX_ADMIN_SECRETfor admin routesMEMEX_API_KEYfor the Tool Playground
Keep both values out of untrusted browsers. If you expose the console outside a local or private network, put it behind your own authentication and proxy admin API calls server-side. MemexAI also does not authenticate end users; your backend must derive userId from trusted server-side identity.
Files
The Files view is the fastest way to prove that memory exists.
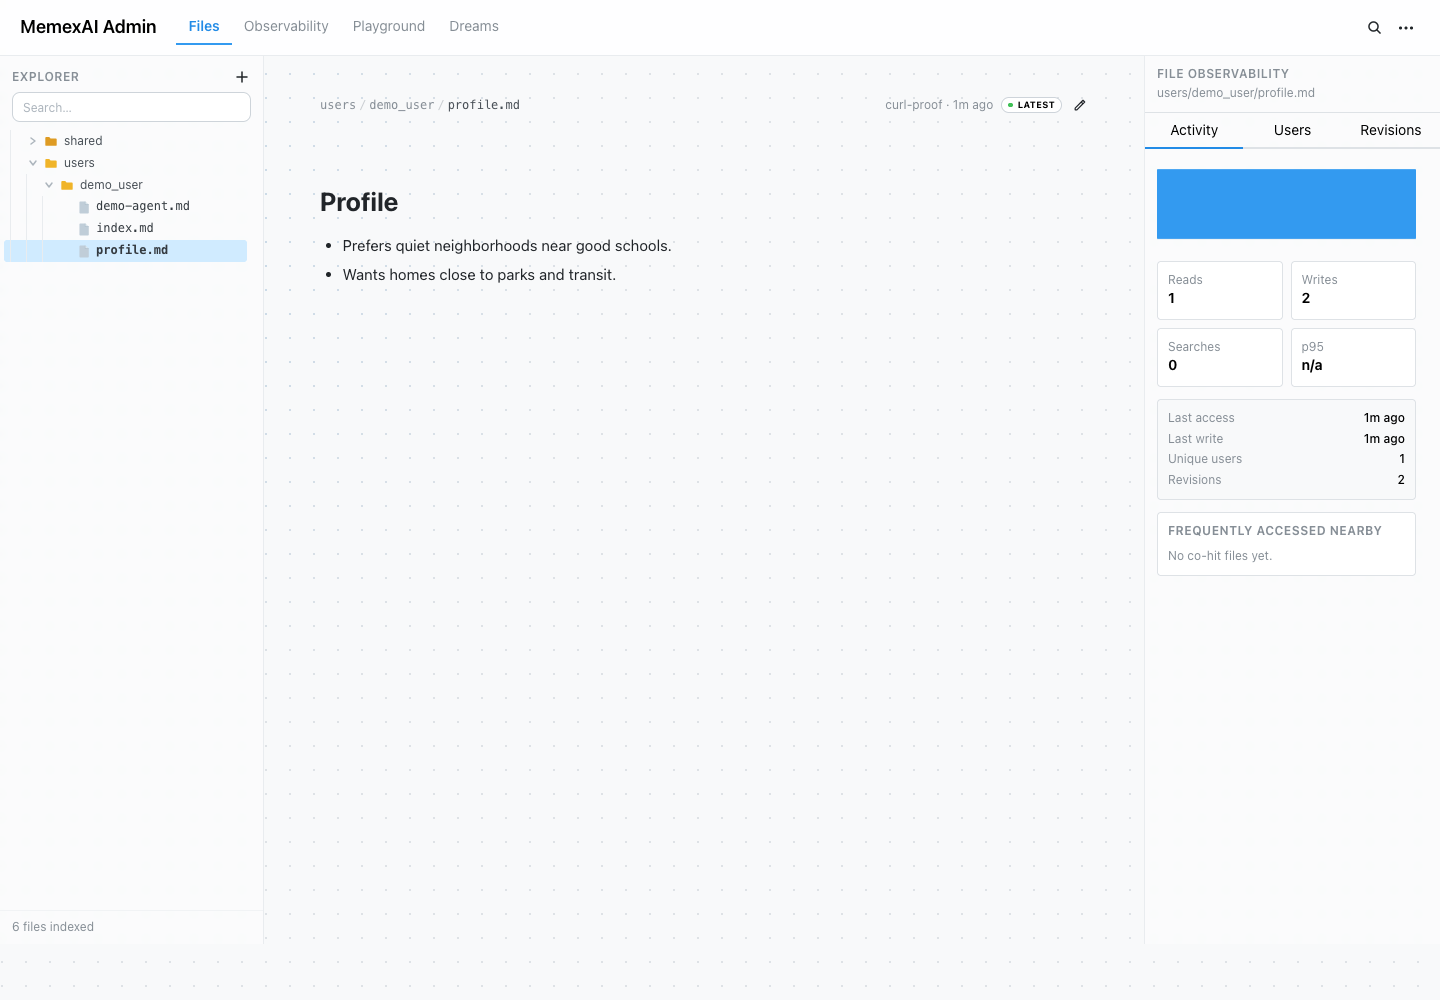
What you can do:
- Browse
users/{userId}/...andshared/...memory as a tree - Open current memory file contents
- Edit a file when memory is wrong or stale
- See file-level reads, writes, revision count, latest actor, and nearby file activity
- Jump from a file to its revisions and activity trail
Agent tools use virtual paths such as user/profile.md. The admin console shows physical paths such as users/user_123/profile.md so operators can inspect exactly what is stored.
Revisions
Every write creates a mx_revision row.
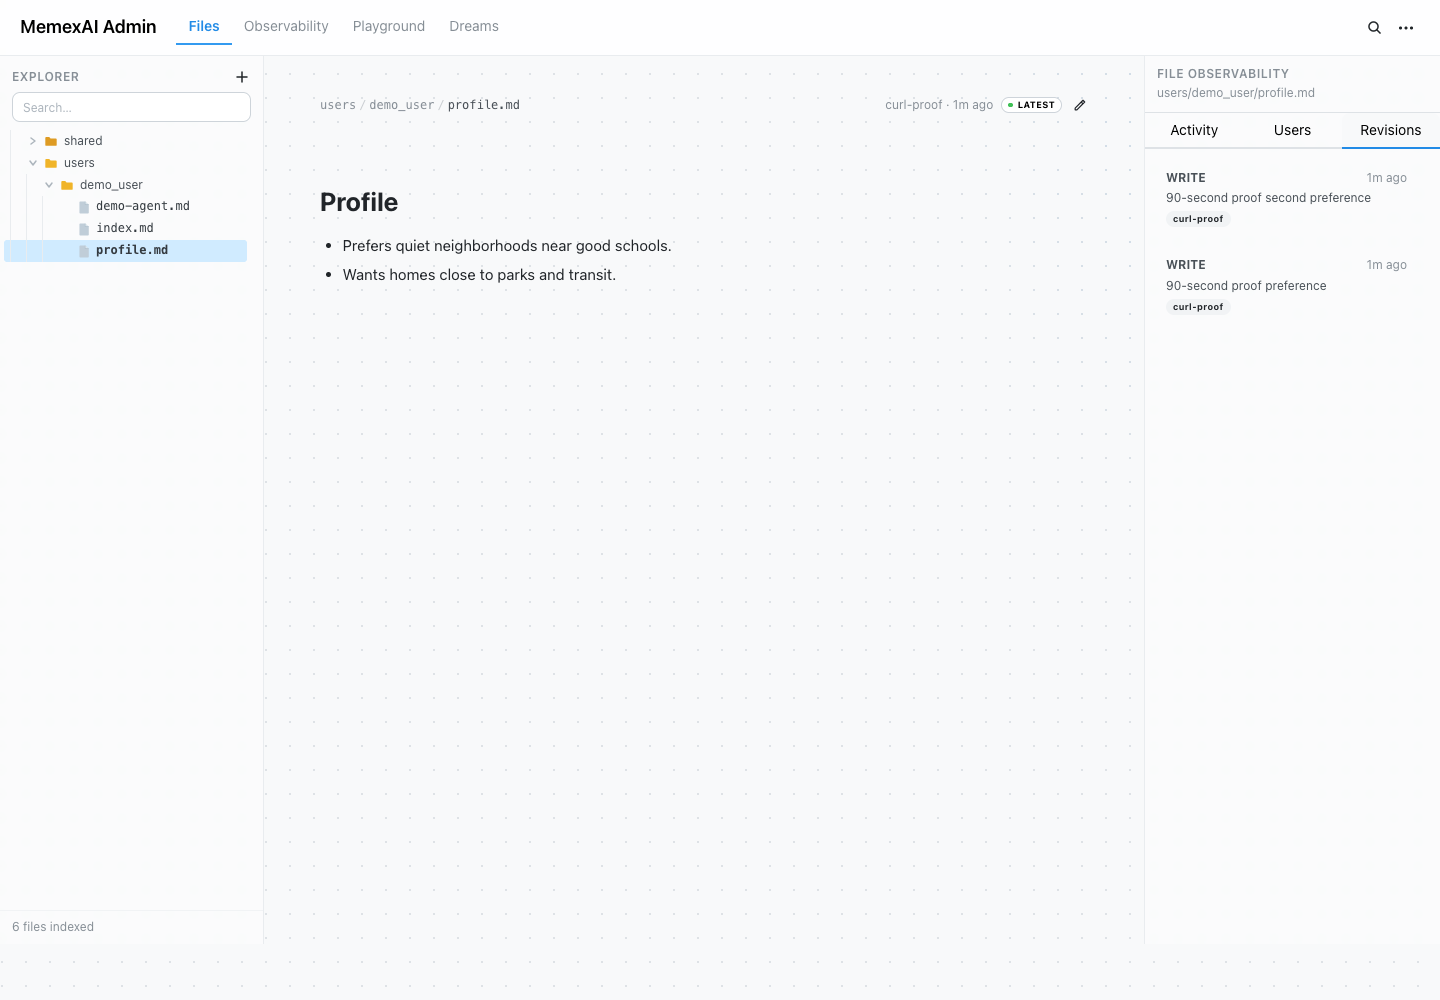
Use revisions to answer:
- What changed?
- Who or what actor changed it?
- Why was the change made?
- Which memory content existed before a correction?
- Did background dreaming write this, or did a user-facing agent write it?
The Revisions view also includes manual pruning for old revision snapshots. Pruning removes old mx_revision rows only; current files and access logs remain until your application deletes or prunes them separately.
Activity and access logs
Access logs show which files agents touched.
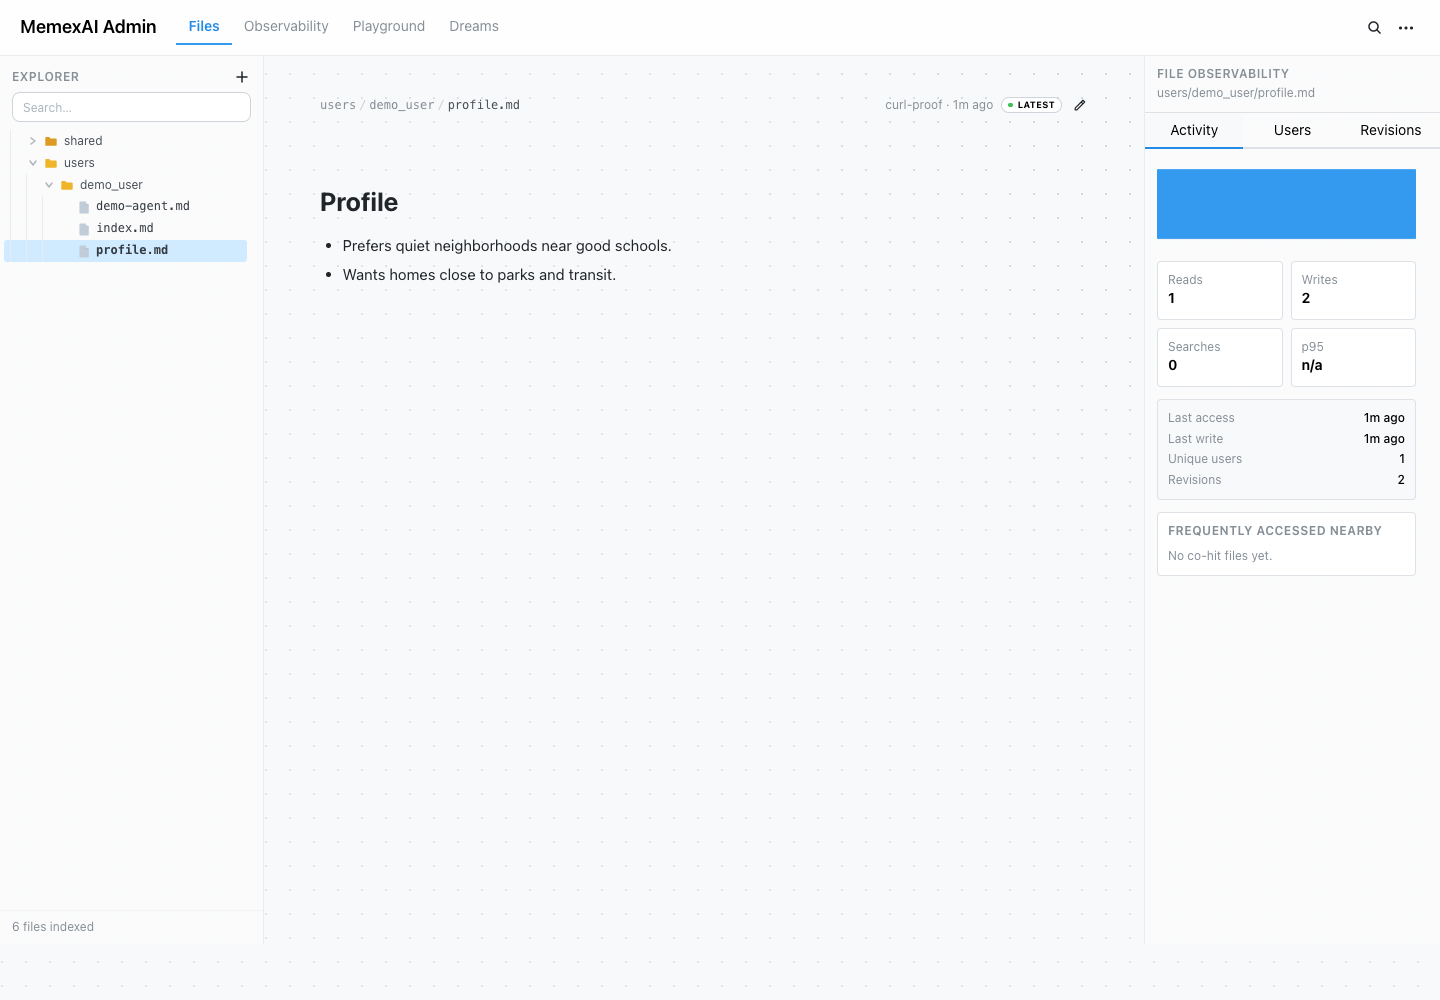
Use activity to debug:
- Whether the agent read the file you expected
- Whether a file is hot, stale, or rarely used
- Which user scope, actor, or tool call touched memory
- Whether a behavior issue is a missing write, missing read, or bad prompt context
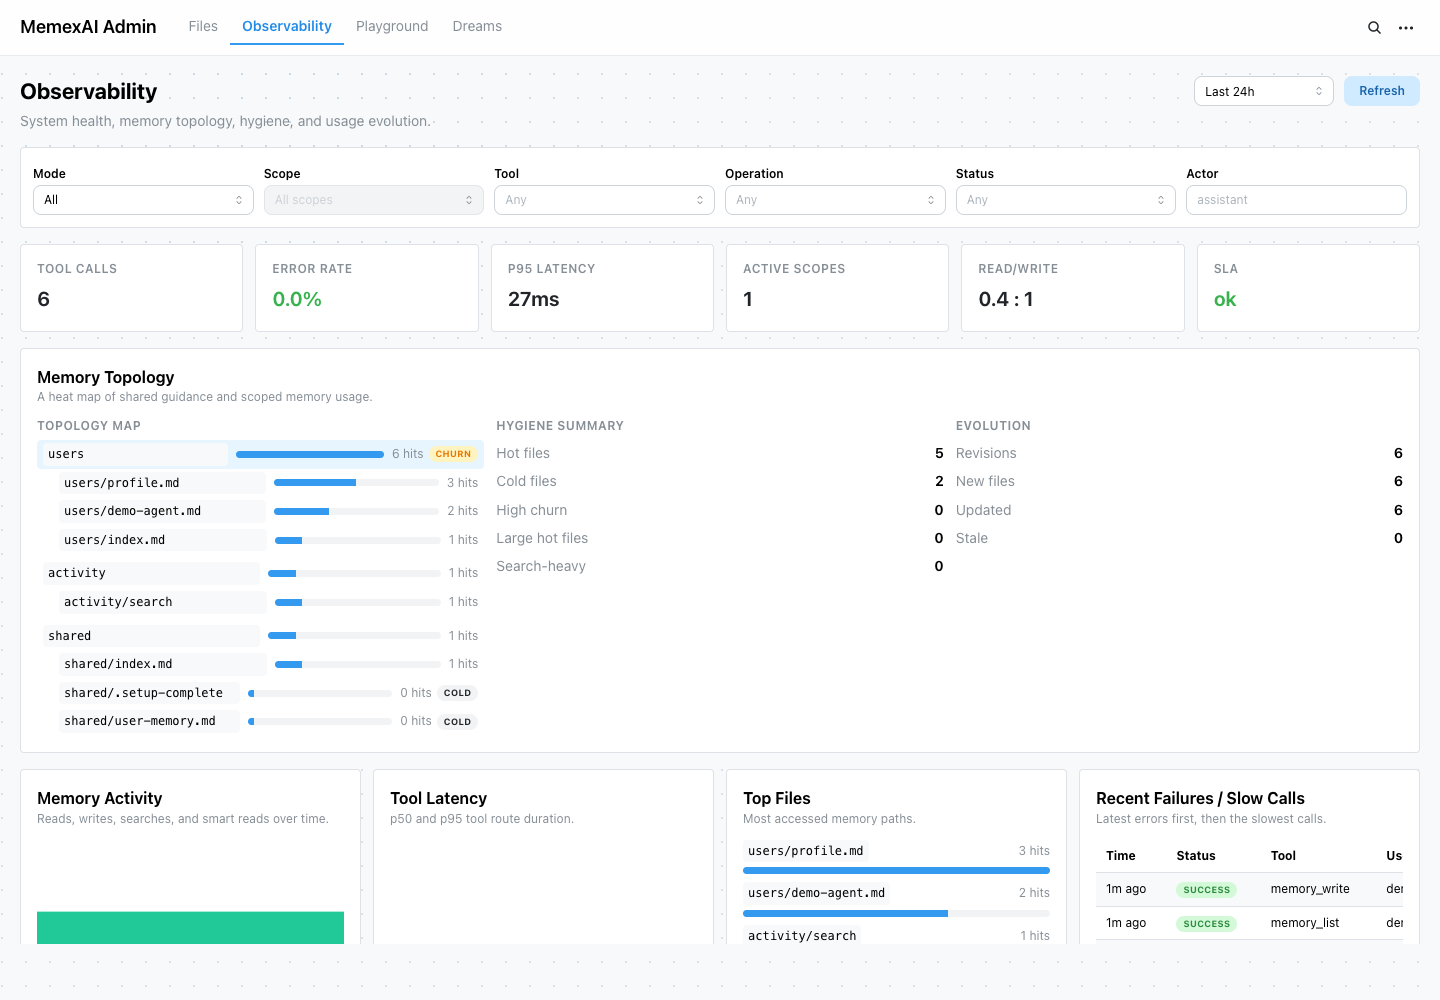
Observability
The Observability view is the operator dashboard for memory health.
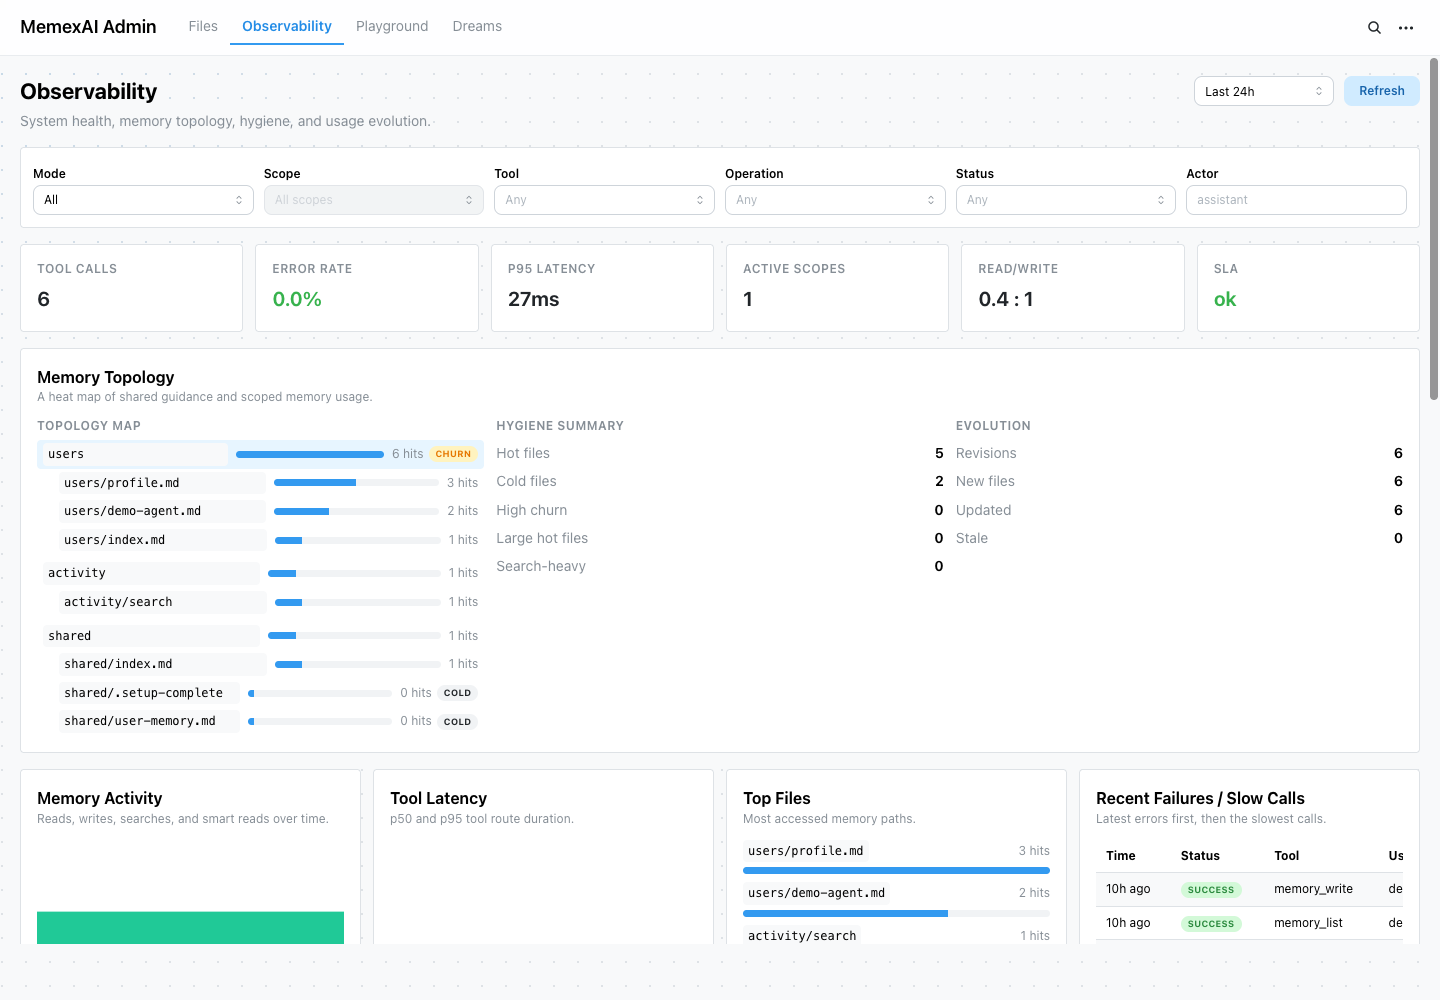
It includes:
- Tool calls
- Error rate
- p95 latency
- Active scopes
- Read/write ratio
- SLA watch state
- Memory topology
- Memory activity over time
- Tool latency over time
- Top accessed files
- Recent failures and slow calls
- Per-user memory hygiene when scoped to a user
- Sanitized observation event stream
Observation events are local, memory-native traces. Root events track each tool execution; child spans show phases such as DB reads, BM25 or hybrid search, embedding, LLM generation, revision writes, and access-log writes. Use traceId or toolCallId from a tool response to connect a product incident to the exact files read, revisions written, and timing breakdown.
MemexAI should keep this local record even when you export sanitized spans to OpenTelemetry. External trace tools can show service latency, but the admin console can also reconstruct memory state and explain whether a failure was caused by a missing write, a retrieval miss, stale memory, or answer synthesis.
Use this view when a product question becomes operational: "Which files are being used?", "Which users have noisy memory?", "Are writes failing?", "Did a new tool route get slow?", or "Which memory nodes are becoming hot?"
Tool Playground
The Tool Playground lets you call MemexAI tools from a local or private operator session before wiring a full app integration.
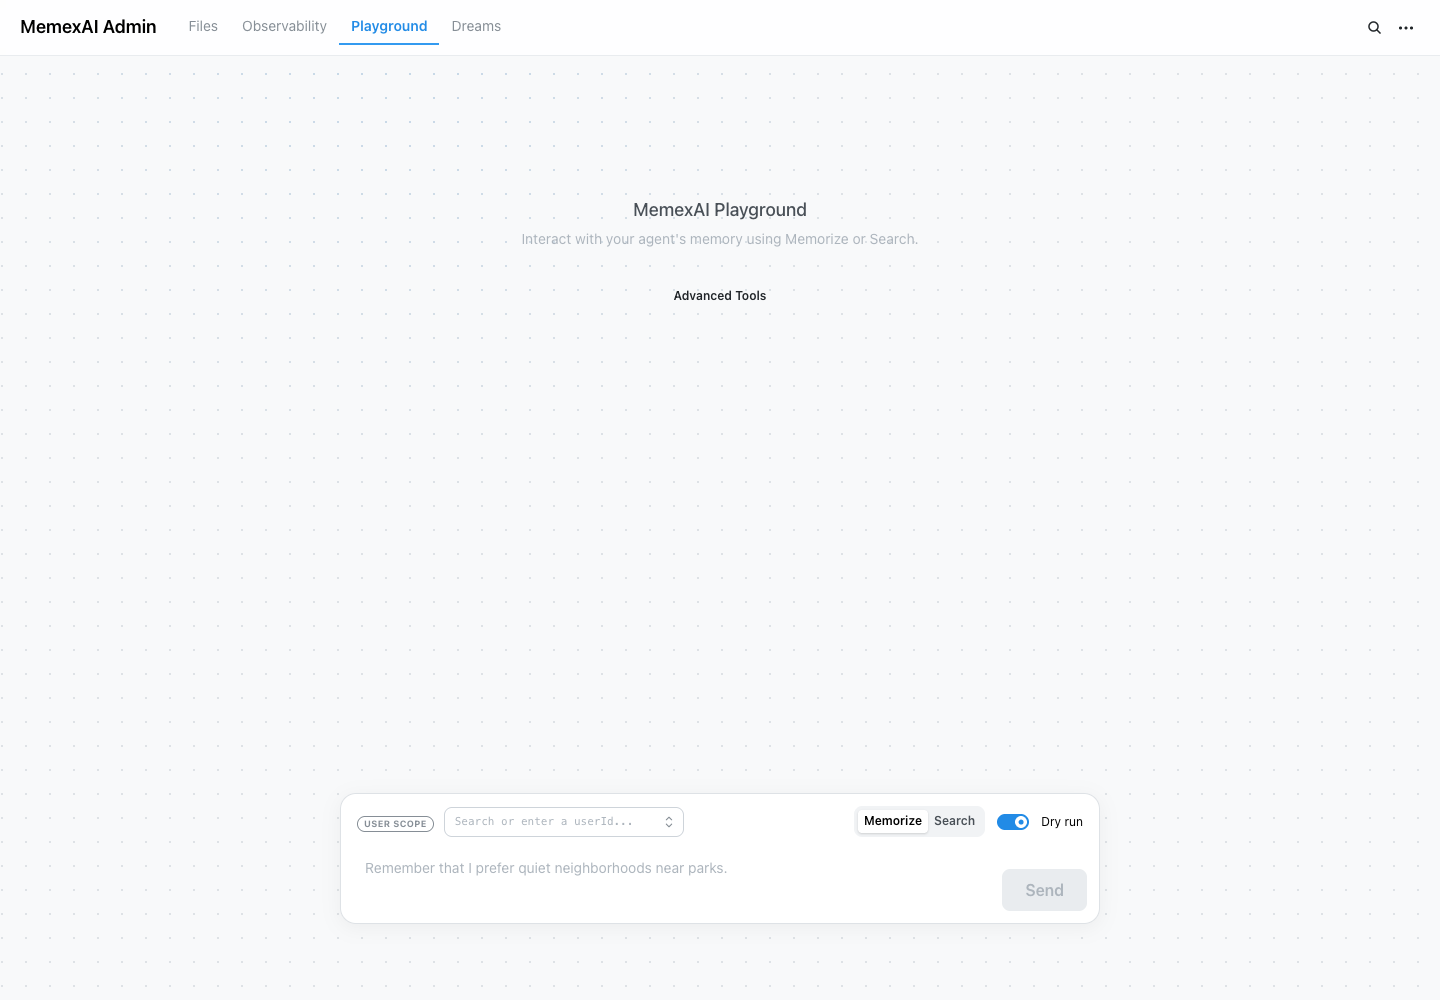
Use it to:
- Run raw tools such as
memory_list,memory_read,memory_write, andmemory_patch - Run agentic tools such as
memory_memorizeandmemory_searchwhen a model is configured - Inspect JSON responses and errors
- Copy TypeScript, Python, and framework-specific snippets
- Verify API keys and service wiring
Without a configured model, memory_search can still use Postgres full-text search, or hybrid pgvector search when an embedding adapter is configured, while memory_memorize returns MODEL_NOT_CONFIGURED.
Dreams
The Dreams panel operates background memory consolidation.
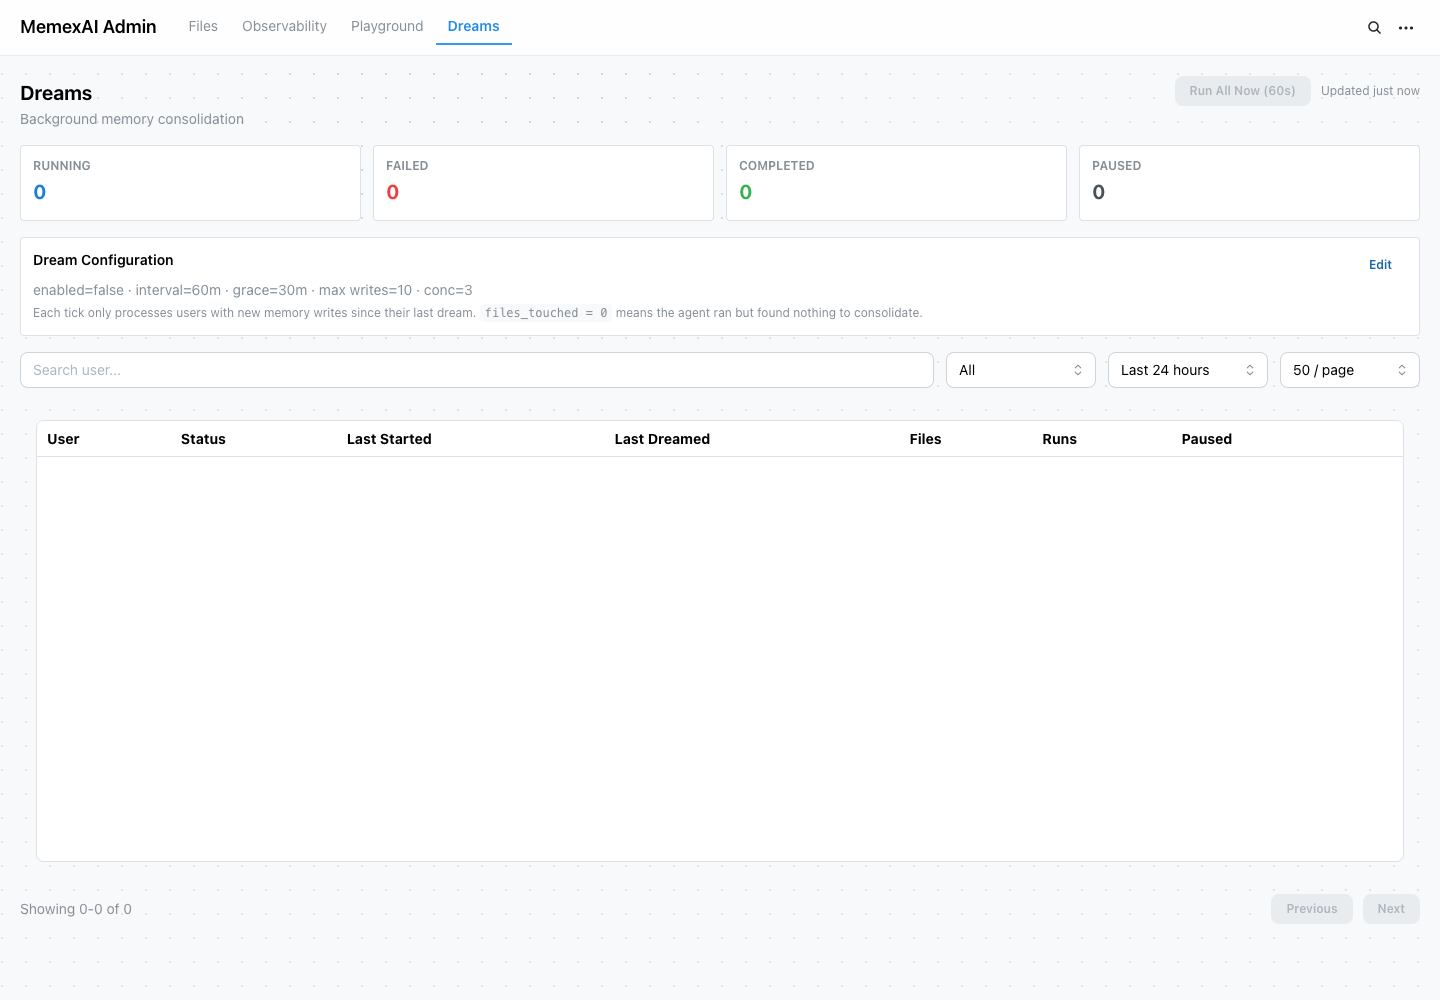
Use it to:
- Read and update dream cadence, grace period, write budget, and concurrency
- Pause or resume dreaming globally
- Pause or resume dreaming for a specific user
- Inspect per-user dream status, failures, last run time, and files touched
- Review dream-agent behavior before enabling it broadly
Dreaming is optional. Start conservative, inspect dream-agent revisions, and widen only after quality and cost are clear.
Admin API map
The console is backed by the admin API:
| Endpoint | Purpose |
|---|---|
GET /v1/admin/users | List user scopes derived from memory files |
GET /v1/admin/files | List memory files |
GET /v1/admin/files/* | Read one memory file |
PUT /v1/admin/files/* | Edit one memory file |
GET /v1/admin/revisions | List write revisions |
POST /v1/admin/revisions/prune | Manually prune old revision snapshots |
GET /v1/admin/access-logs | List access log rows |
GET /v1/admin/observability/* | Read memory health, topology, activity, and event data |
GET /v1/admin/dream/* | Read dreaming config and per-user status |
PUT /v1/admin/dream/* | Update dreaming config or pause state |
For production caveats around retention, concurrency, and security boundaries, see Production Considerations and User ID Trust Model.